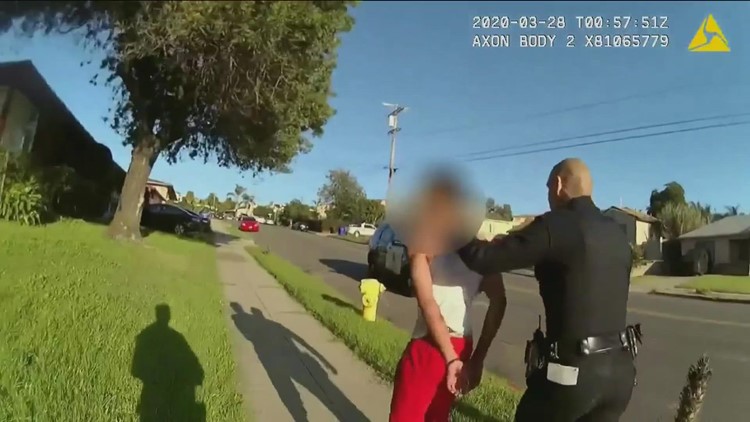
SAN DIEGO — San Diego Police are nearly seven times more likely to use force on Black suspects than they are on White and Hispanic suspects, according to data obtained by CBS 8.
From 2018 through 2022, San Diego police used force or threatened to use force on 3,303 Black people. During that same five-year span, police used force on 3,967 Hispanic people and 4,520 White people. However, Black people, according to the San Diego Association of Governments (SANDAG) account for only 6 percent of San the city's population while White people represent 45 percent and Hispanic people make up 31 percent of the population.
When looked at on an annual basis, 2022 saw the highest number of force used on Black people with 773 force incidents reported. That was 115 more incidents than was recorded in 2018 and 135 more than in 2019, prior to the pandemic.
The data also shows disparities in the types of force used by race. While Black residents were more likely to have force used on them than White or Hispanic people, the data shows that police pointed their weapons at Hispanic people more frequently than Black and White people.
A police spokesperson tells CBS 8 that it is important to remember that officers use force in only a very small number of cases, approximately 2 percent of total encounters.
The SDPD spokesperson also noted that approximately 70 percent of use-of-force incidents occur when community members call police to the scene for some type of disturbance, meaning officers are not engaging but instead reacting to the situation.
Despite the caveats, the data is useful in showing the different tactics that police officers employed when using force with suspects.
The Methodology
To obtain the numbers, CBS 8 looked at the total number of use of force and threats of force reported by San Diego Police. Duplicates were then deleted. For example, if three officers arrived at the scene and each used or threatened to use force on one individual then three incidents would get reported. To do that CBS 8 deleted any duplicate incident numbers and call numbers from the data.
The data was then filtered by race and the year it occurred. Once filtered, we then took the average population of each race and ethnicity and divided it by the number of use-of-force reports, and multiplied it by one thousand in order to get a whole number.
For example, in 2022, after deleting duplicate encounters, SDPD reported 773 instances of force on Black people. CBS 8 used the population numbers from SANDAG to get the total population of Black people in San Diego. We then divided the annual use of force numbers for the given year, 773 in the case of Black people in 2022, and divided it by the average population of 80,049. We then multiplied that number by a thousand to get 9.65 people per 1,000 had force used on them. CBS 8 then repeated that calculation for each race or ethnicity each year.
The Results
After filtering, the data shows that Black people were anywhere from five times to eight times more likely to have force used on them or threatened to have force used on them than White and Hispanic persons were between 2018 through 2022.
The data also shows that while the number of force reports dropped during the pandemic, instances increased for Black residents to a five-year-high in 2022 while the number of instances for White and Hispanic people remained largely the same.
National numbers released by the Bureau of Justice in 2022 mirrored San Diego's use of force data, also showing that Black people were more likely to be threatened with force or have force used against them than their White or Hispanic counterparts. That data revealed that nationally Black people are approximately three times more likely to have force used on them than White people.
Types of Force Used
According to the San Diego Police Department, officers use force only to overcome some type of resistance from the person they encounter, or in cases where members of the public are in danger.
Force can range from verbal commands, to take downs, to restraints, to pointing their weapons at the subject.
According to police data, the most common type of force used on suspects was the use of "physical strength" to subdue those during police interactions.
The second most frequent method of force used was pointing firearms at those encountered. When factoring in race or ethnicity, police point their handguns or weapons at Hispanic people 26 percent of the time when force is used or threatened to be used. That is compared to 22 percent during altercations with Black people and 17 percent of instances of force with White people.
Lauren Bonds serves as the Executive Director for the National Police Accountability Project, a non-profit that advocates for legislation and works to hold law enforcement agencies accountable.
Bonds says that the non-profit has seen an increase in use-of-force since the pandemic.
In a lot of the cities we have seen an increase in the number of use of force incidents," Bonds tells CBS 8. "Overall, we're seeing increases in policing, more police contact being initiated."
Bonds says one reason for the increase in policing is that some cities are reporting that crime is on the rise.
"There was a moment of pulling back on excessive policing. Unfortunately, we're seeing the pendulum swing back due to concerns about rising crime rates."
Bonds also says that many large cities across the country have focused on more low-level crime such as traffic infractions as a way to send a message to residents.
"Police departments are enforcing kind of low-level quality of life crimes, whether that be a broken taillight, or, too many cars in their yard, more quality of life crimes that aren't really hurting anybody. That is part of an overarching philosophy in policing that if you let these things go, then bigger crimes will occur, that it signals to criminals who are going to do more violent, problematic things that the police aren't, you know, paying attention or doing things there."
Bonds adds that looking at even low-level use-of-force incidents as well as threats on a city basis is important to show the broader issue that many cities and their residents experience on a day-to-day basis.
"A lot of times when we think about police violence, we really think about it, as you know, these really egregious incidents that happen every, you know, two to three years that, that capture, you know, national media attention, cases such as Tyree Nichols, and George Floyd, before him," said Bonds. "But these kind of daily interactions that anybody could be subjected to are much more representative of how police could inflict harm on people. It's really important to have these numbers out there to, you know, be able to demonstrate the different ways in which there are disparities in those numbers because oftentimes it provides a more accurate picture of how pervasive, you know, police violence really is."
San Diego Police Response
San Diego Police spokesperson Lieutenant Adam Sharki says that a good reason for an increase in the use of force reports is that more actions used by police now are considered as force, as well as threats of force.
"Use of force is most consistently predicted by the level of resistance officers encounter. Use of force is also characterized as a 'response to resistance.'" says Lt. Sharki. Research on police use of force identifies several other important factors that influence the use of force and the severity of the force employed."
Lt. Sharki also says there is a problem with using overall census data to tell the use of force numbers, saying some researchers "have found using census data as a benchmark is an oversimplified and flawed method of analysis."
Adds Sharki, "For instance, SDPD research has shown that 36 percent of all force used takes place in just 12 out of the 125 beats that SDPD patrols. The areas where force is most often used are North Park, East Village, Pacific Beach, and the Gaslamp. This may suggest places where people gather in large numbers and where alcohol is served contributes to arrests and use of force."
In communities such as Pacific Beach, the number of White people who are contacted by police and have some low level of force used on them dwarfs the number of Black people in the same area, from 69 percent White to just 9 percent Black.
Whereas, Lt. Sharki says in East Village where a disproportionate number of homeless people are people of color, those numbers tell a much different story.
"In East Village, the homeless population is roughly 20 to 30 percent African American. Mental illness and substance abuse disproportionately affect homeless communities. When stops were conducted in the East Village and force was used, it involved African-Americans 32 percent of the time and Whites 40 percent of the time."
Adds Sharki, "These examples illustrate the complexities of analyzing the use of force in response to resistance."
In addition, more than 15 new types of force were added to the list, says Lt. Sharki, making a "year-to-year comparison inconsistent."
However, Bonds from the National Police Accountability Project says factoring population, especially large population differences as seen in San Diego is needed in order to see the true scope of the issue.
"Factoring population size is a meaningful way to identify a disparity, particularly when there's that big of a difference between those two population sizes. It's not like these two populations are close. If you're seeing higher numbers for a much smaller population, there's no way of getting around the fact that there's a problem."


